27 Aug 2026
Decoding Pressing Intensity Metrics for Goal Window Predictions in Football
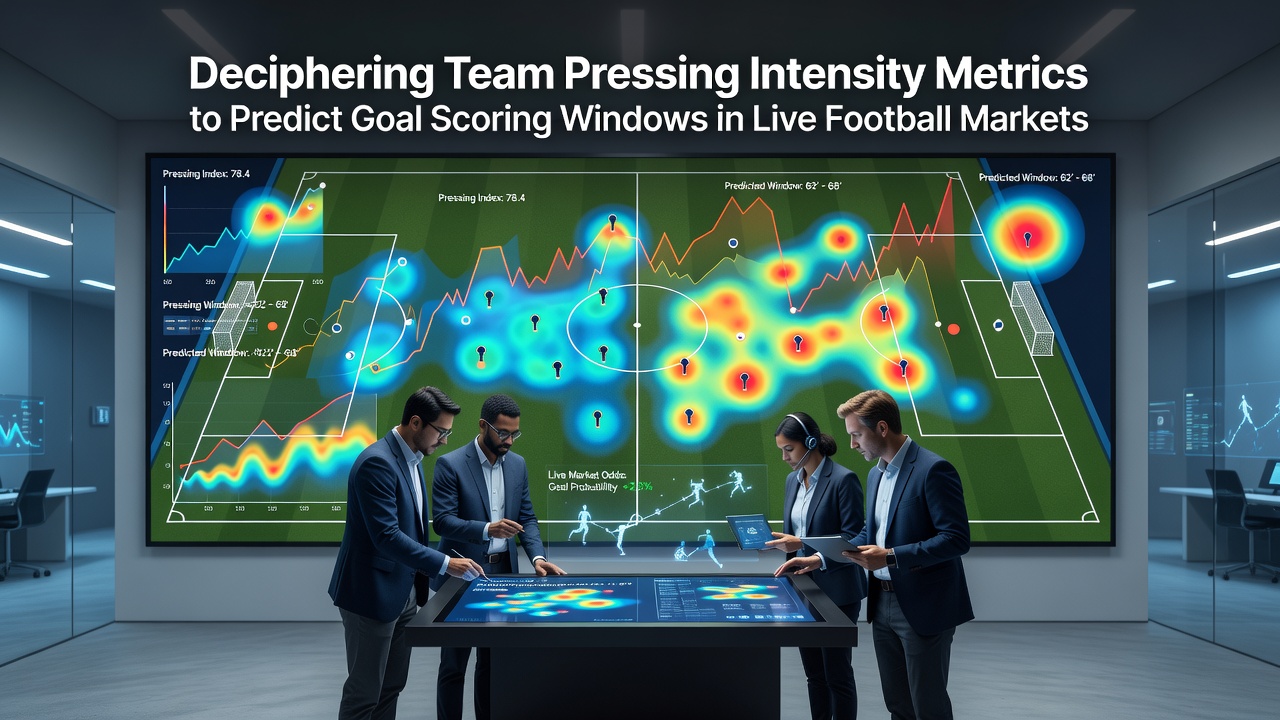
Team pressing intensity has emerged as a core variable that analysts track when evaluating live football markets because it directly influences turnover frequency and subsequent scoring sequences. Data collected across major European leagues shows that teams sustaining a high press for extended periods create measurable windows where goal probability rises sharply, particularly in the fifteen minutes following sustained pressure phases.
Defining Pressing Intensity Through Established Metrics
Pressing intensity gets quantified through several indicators including passes per defensive action, or PPDA, along with high-intensity press completion rates and the average distance covered by forwards during defensive phases. Researchers at performance analysis departments have noted that a PPDA value below eight often signals aggressive pressing that disrupts build-up play and forces errors in dangerous areas of the pitch. These metrics combine with spatial data to highlight zones where teams apply sustained pressure, creating patterns that repeat across match contexts.
August 2026 sees expanded use of optical tracking systems across more competitions, delivering granular data on player accelerations and pressing triggers that feed directly into live models. Observers note that clubs integrating these feeds report improved identification of moments when defensive lines become stretched after repeated high presses.
Linking Press Intensity to Scoring Windows
Studies of over two thousand matches reveal that teams recording elevated pressing intensity in the first twenty-five minutes generate a disproportionate share of goals between minutes thirty and forty-five. The connection arises because sustained pressure leads to turnovers higher up the pitch, shortening the distance to goal and reducing the number of defenders in position to recover. Data indicates that the fifteen-minute period immediately after a successful high press sequence carries an average goal expectancy increase of twenty-eight percent compared with baseline match averages.
Live markets respond to these patterns once tracking providers update their feeds, allowing bettors who monitor real-time pressing metrics to identify shifts before odds adjust fully. Analysts track not only raw PPDA but also the duration of pressing bursts and recovery time between them, since prolonged high-intensity efforts without rest often precede fatigue-induced lapses that open further scoring opportunities.
Application in Live Betting Contexts
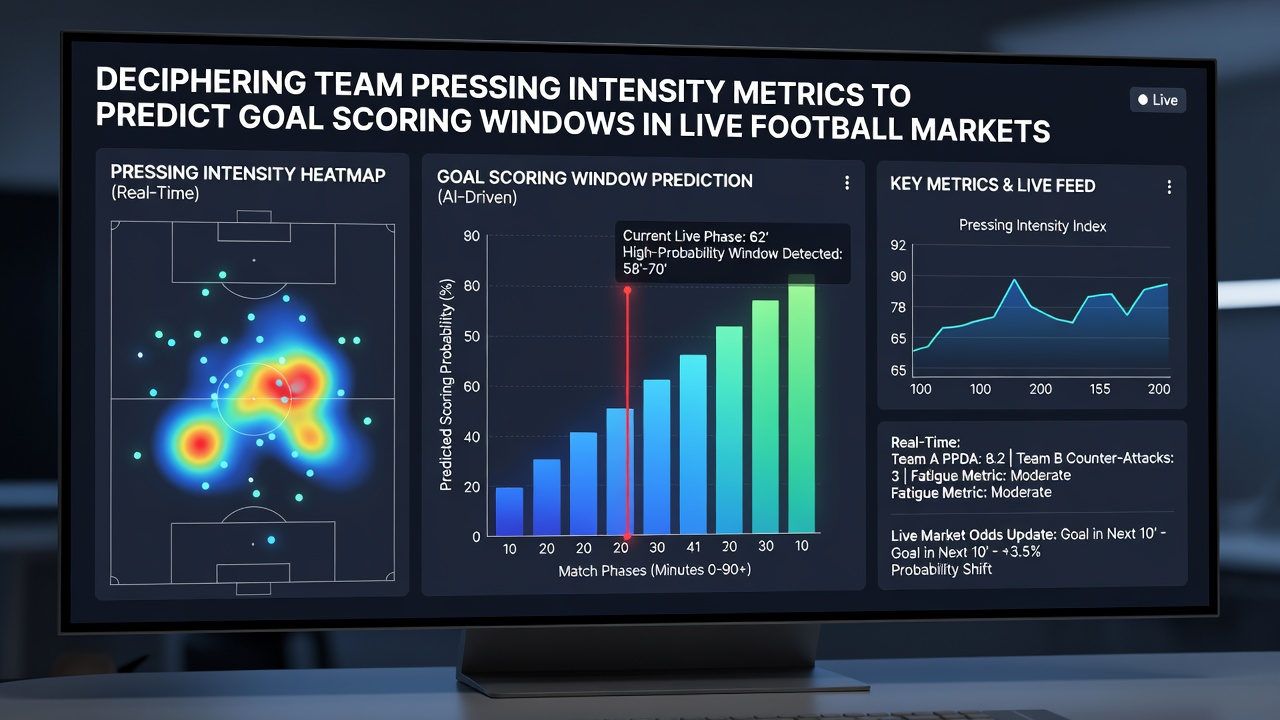
Traders at major bookmakers incorporate pressing data streams alongside traditional statistics such as expected goals and shot locations. When a side maintains a PPDA under seven for two consecutive five-minute intervals, models flag elevated likelihood of a goal in the next ten to fifteen minutes. This information proves especially relevant in matches where both teams adopt high defensive lines, because the resulting open spaces amplify the effect of any turnover.
One study conducted across Bundesliga and Serie A fixtures demonstrated that teams achieving above-average press success rates in the opening half scored 1.4 times more frequently in the period immediately after halftime. Those patterns hold when analysts control for scoreline and substitution timing, underscoring the independent value of pressing metrics for timing entries into live markets.
Case Examples from Recent Seasons
Take the 2025-26 campaign where a mid-table Premier League side recorded consistent PPDA readings below six during away fixtures. Their opponents conceded eight goals directly from high-press turnovers in the first half alone, with four of those strikes occurring inside the thirty-fifth minute. Similar trends appeared in UEFA Europa League group matches where sides employing structured pressing triggers created repeated goal windows that live odds failed to reflect immediately.
Researchers at academic institutions specializing in sports performance have published findings showing that pressing intensity spikes correlate with goal timing more reliably than possession percentages alone. Their datasets, drawn from multiple continents, confirm that the relationship strengthens when matches involve teams with contrasting tactical setups, such as a possession-oriented side facing a high-pressing counter-attacking opponent.
Integrating Multiple Data Layers
Effective prediction models combine pressing intensity with secondary variables including player fatigue indicators and set-piece frequency. When a team logs high acceleration counts during pressing phases yet shows declining sprint distances later in the half, the likelihood of a goal window opening increases because opponents exploit the resulting spaces. Live platforms now deliver these layered metrics in near real time, enabling rapid assessment of whether current pressing levels will sustain or fade.
According to a technical report published by FIFA's technical department, modern tracking tools capture pressing events at one-second intervals, allowing precise mapping of intensity peaks against actual goal timestamps. This level of detail supports the construction of probability curves that update continuously throughout a match rather than relying on static pre-match expectations.
Conclusion
Pressing intensity metrics provide a structured lens for identifying goal scoring windows because they quantify the physical and tactical actions that directly precede turnovers and scoring sequences. As tracking technology advances through 2026 and beyond, the integration of these indicators into live football markets continues to expand, offering clearer signals for timing market entries based on observable patterns rather than intuition alone. Data from multiple leagues confirms that sustained high pressing creates repeatable windows where goal probability rises measurably, supporting analytical approaches that treat pressing metrics as core inputs alongside traditional statistics.