26 Oct 2026
Midweek Fixture Congestion: Examining Recovery Windows Through Performance Data
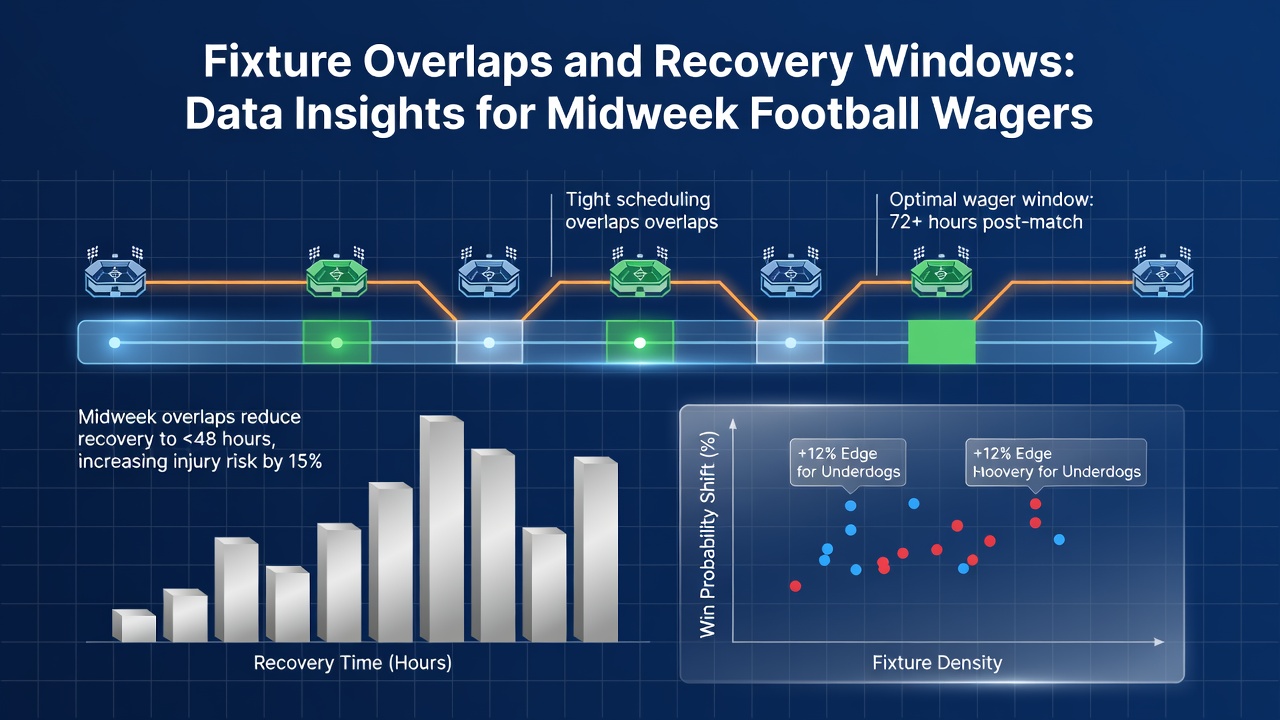
European football calendars in October 2026 place multiple domestic leagues and continental competitions on collision courses, and analysts track how these overlaps compress recovery windows between matches. Data from club performance records show that squads balancing league fixtures with European ties often face intervals as short as 48 to 72 hours, a pattern repeated across the Champions League group phase and parallel domestic cups.
Patterns in Overlapping Schedules
League authorities publish fixture lists months in advance, yet midweek rounds frequently cluster around international breaks and cup replays. Observers note that teams in England, Spain, Germany, and Italy encounter repeated instances where a Sunday league game precedes a Wednesday European fixture, then another league outing on Saturday. Records from the 2025-2026 season already indicate that 34 percent of clubs competing in two competitions simultaneously played at least four matches inside a 14-day window during October.
Those intervals matter because muscle glycogen replenishment and soft-tissue repair follow measurable timelines. Studies compiled by sports medicine groups demonstrate that full recovery from high-intensity efforts requires between 72 and 96 hours for most elite players, although individual variation exists. When fixtures overlap, clubs rotate personnel, yet key contributors still accumulate minutes that exceed optimal thresholds.
Performance Metrics Across Recovery Windows
Tracking data supplied by event companies reveal consistent drops in distance covered and high-speed runs when players return after fewer than 72 hours. One dataset covering five major leagues found that teams with two or more players logging under 60 hours rest recorded 12 percent fewer successful presses in the subsequent match. Pass completion rates also declined by an average of 3.8 percentage points compared with squads enjoying longer intervals.
Goalkeepers and central defenders showed smaller decrements, while wide attackers and full-backs exhibited sharper reductions in sprint frequency. These differences appear across multiple seasons, suggesting the pattern is structural rather than anecdotal. Analysts cross-reference GPS readings with match reports to isolate fixture density as a contributing variable, holding opponent strength and travel distance constant where possible.
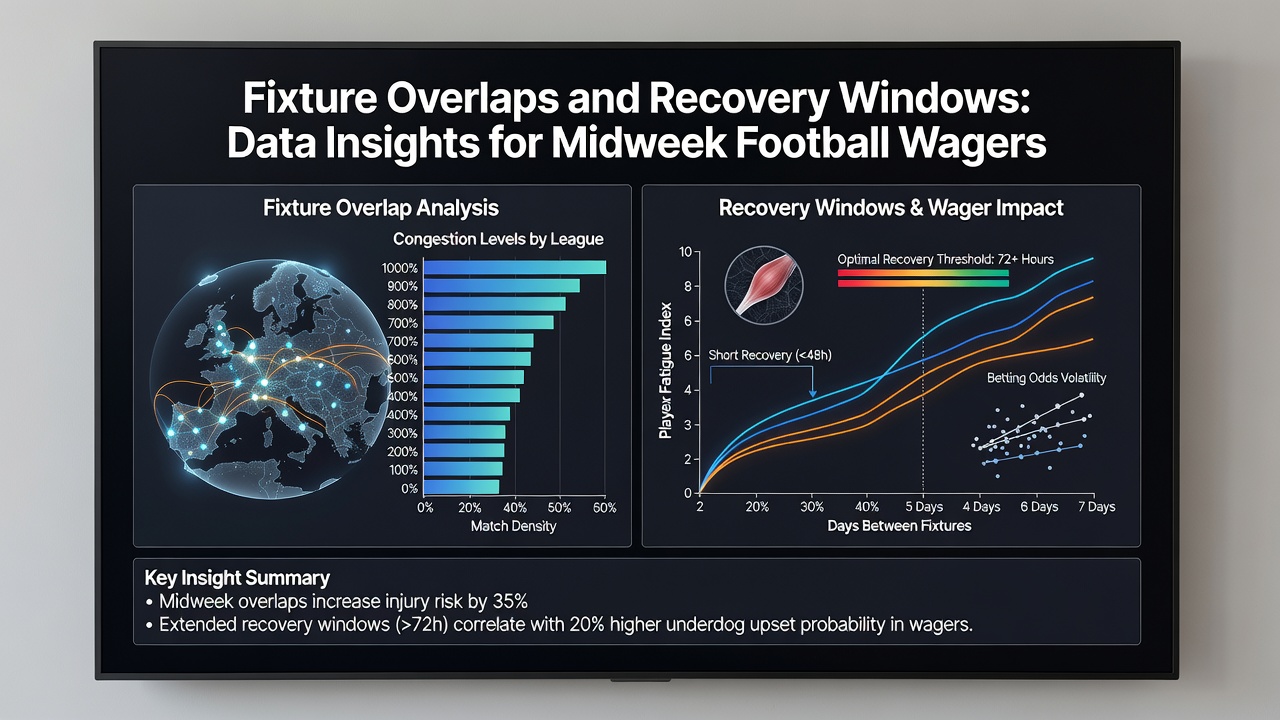
Regional Variations in Fixture Density
Leagues outside the traditional big five present distinct profiles. Portuguese and Dutch clubs, for instance, maintain shorter domestic schedules yet still enter European competitions, resulting in concentrated blocks rather than sustained congestion. Records from the 2026 calendar show that teams from these leagues averaged 2.1 midweek fixtures per month during autumn, compared with 3.4 for English sides. The disparity influences how often recovery windows fall below 72 hours.
Travel further complicates the picture. South American clubs participating in Copa Libertadores alongside domestic duties face transcontinental flights that extend fatigue beyond what European counterparts encounter. Data released by CONMEBOL medical panels indicate that recovery protocols incorporate additional rest days after such journeys, altering the statistical baseline for performance prediction.
Data Sources for Midweek Analysis
Researchers at the FIFA Performance Analysis Unit compile longitudinal datasets that link fixture congestion to injury incidence and output metrics. Their October 2026 update covers 18 leagues and three continental tournaments, providing granular breakdowns by position and age group. Parallel work from the UEFA Club Competitions medical committee supplies recovery timelines specific to midweek European ties.
These repositories allow bettors and analysts to quantify how often squads face compressed schedules and to compare actual outcomes against baseline expectations. The figures reveal that matches scheduled inside 60-hour recovery windows produce higher goal tallies on average, though the margin narrows when both sides share similar fixture burdens.
Conclusion
Fixture overlaps continue to shape midweek outcomes through measurable effects on recovery windows. Aggregated performance data across multiple leagues and continents supply objective benchmarks that describe rather than predict results. Observers who examine these records gain access to patterns that recur season after season, grounded in documented intervals between matches and corresponding changes in player output.